


A latency alert fires in production. The dashboard turns red and nobody knows why. The failure looks nothing like any of the ones somebody set up alerts for, so the team opens logs blind, tests theories and loses the morning. That is where classic monitoring stops, and it is exactly the gap observability fills.
You can buy the licence. You cannot buy the ability to use it. This guide separates the two, with our own data on the UK market.
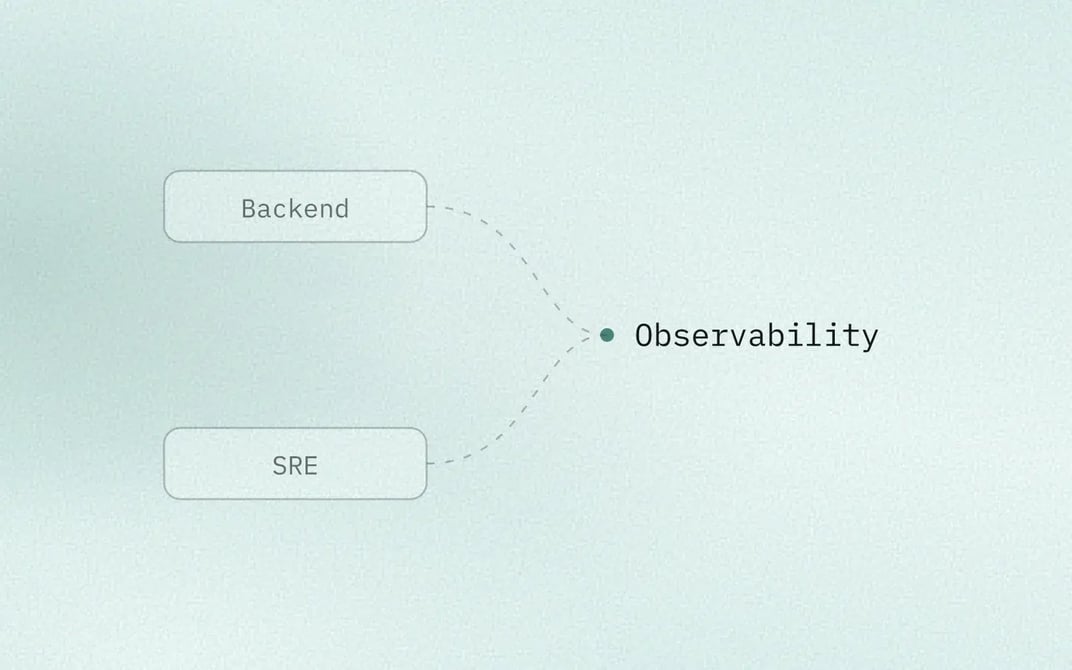
Observability is the ability to understand the internal state of a system from the signals it emits: metrics, logs and traces. Monitoring tells you about the things you already knew to watch; observability lets you investigate failures nobody anticipated. In the UK it rarely arrives as a job title of its own: it sits across DevOps, SRE, platform and software engineering roles.
Where does observability come from, and what does it mean in IT?
Observability is the property of a system that lets you work out what is happening inside it from what it exposes to the outside, which in software means being able to answer new questions about production without shipping new code just to answer them.
The term did not start in IT. Rudolf Kalman formalised it in 1960, in control theory and alongside its conceptual twin, controllability, to describe when the internal state of a dynamic system can be reconstructed from its measurable outputs, and software engineering borrowed it decades later with the same idea underneath.
In practice it fits in one question. Something fails in a way nobody predicted: can you find the cause with the data you already collect? If so, the system is observable. If you have to add logs and wait for it to happen again, it is not.
How is observability different from monitoring?
Monitoring watches known conditions; observability lets you investigate the unknown ones. No contest. One contains the other.
| Dimension | Monitoring | Observability |
|---|---|---|
| Question it answers | Is something we already know about failing? | Why is it failing, even if it is something new? |
| Starting point | Thresholds and dashboards defined in advance | Data with enough context to explore afterwards |
| Best fit | Monoliths and stable systems | Microservices and Kubernetes |
| Typical output | An alert | A diagnosis |
The more distributed the system, the more it matters. In a monolith, the source can be found. In an architecture with dozens of services on Kubernetes, by contrast, a slow request can pass through eight different services before returning an error, and a dashboard defined in advance rarely tells you in which of them the seconds the user did notice were lost.
What are the signals of observability?
There are three classic signals. Each answers a different question.
- Metrics. Numerical values aggregated over time, such as latency, error rate or CPU usage. They are cheap to store and tell you something is wrong, but rarely why.
- Logs. Timestamped records of events. Detail, at a price: volume.
- Distributed traces. The full path of a request through every service it touches: the most direct signal for seeing where time is lost in microservices.
Talking about "three pillars" now falls short, because teams that have run distributed systems in production for years add business events and continuous performance profiles to those three signals, and techniques such as eBPF capture signals from the kernel without touching the application. What decides the outcome is not how many signals you collect. It is whether they are correlated: whether you can jump from an anomalous metric to the trace and the log of that same request.
Why has OpenTelemetry become the standard?
OpenTelemetry is the open standard for instrumenting applications and emitting metrics, logs and traces in a common format that most backends accept, either directly or through exporters. It is maintained by the Cloud Native Computing Foundation.
Its value is architectural, and it shows the day a contract with a vendor comes up for renewal and the team realises that leaving would mean touching every service again. Previously, every commercial platform shipped its own agent and its own format, so switching vendor meant instrumenting the code again, whereas with OpenTelemetry you instrument once and changing destination becomes mostly a matter of configuring the Collector and its exporters.
What tools make up an observability stack?
A stack has four layers: instrumentation, collection, storage, and visualisation with alerting. The signal is born in instrumented code, passes through a collector such as the OpenTelemetry Collector, is stored in a backend and is queried from dashboards and alerts. Two families of tools.
The open stack usually combines Prometheus for metrics, Grafana for visualisation, Loki or the ELK stack (Elasticsearch, Logstash and Kibana) for logs and Jaeger for traces, with OpenTelemetry as the instrumentation layer. There is no licence fee. There is storage, maintenance and people.
Commercial platforms such as Datadog, Dynatrace, Splunk or New Relic bring the four layers together in a single product with their own agents, automatic anomaly detection and support, and they charge per host, per volume of data ingested or per user, so the bill depends on the size of the infrastructure.
Who runs observability in a company?
In the UK, observability rarely arrives as a job title of its own. According to Shakers' market analysis, 2,275 tech job adverts published in the UK between June and November 2026 mention at least one observability tool. Only 28 have the word in the job title.
Method: UK tech job adverts collected by Shakers Market from 19 June to 16 November 2026 that name an observability tool in the title or description (Grafana, Prometheus, Datadog, Dynatrace, Splunk, OpenTelemetry, ELK or Loki, among others), with the term verified in the text and without counting the same company and title twice. It measures where the skill appears, not how many roles require it.
DevOps is the role that asks for it most, but not the only one.
| Role | Job adverts |
|---|---|
| DevOps Engineer | 276 |
| Site Reliability Engineer | 173 |
| Platform Engineer | 127 |
| Software Engineer | 94 |
| Backend Developer | 49 |
| Data Engineer | 42 |
By family, Cloud & DevOps accounts for 1,165 adverts, Software Engineering 639 and Data & Analytics 141.
The same sample shows which stack is in demand, and here the UK stands out: Grafana or Prometheus appear in 1,361 adverts, against 1,114 that ask for Datadog, Dynatrace or Splunk (they are not exclusive: 411 name both). The split is far closer than in Spain, where the same analysis finds the open stack ahead by almost two to one.
If observability is spread across roles, what you are looking for is not a title but a skill: instrumenting with OpenTelemetry, designing useful metrics and reading a trace under pressure, which is the shift from thinking in roles to thinking in skills, and which can sit in a DevOps, SRE or platform engineering role or with a senior backend engineer. Checking it means seeing it applied to a real system. A CV is not enough.
How do you measure whether observability works?
With service objectives, not with the number of dashboards. An SLI is the observed data, for example the percentage of requests answered in under 300 milliseconds, and an SLO is the internal target the team sets on that data over a time window, usually tighter than anything promised to customers in a contract. The error budget is the margin the SLO leaves: if the target is 99.9% over 30 days, the remaining 0.1% is the failure the team can spend before freezing deployments.
The real test is time to diagnosis: if, faced with an incident nobody has seen before, the team finds the cause with the data it already has, without reproducing the failure or rushing out new traces while the customer waits, observability is working. If not, it is not.
Frequently asked questions about observability
- How is observability different from monitoring?
Monitoring watches conditions defined in advance and alerts you when they are met. Observability collects signals with enough context to investigate failures nobody anticipated. In distributed systems, with many services chained together, monitoring on its own leaves unexplained the failures nobody predicted.
- How much does it cost to implement observability?
It depends less on the tool than on the volume of data and on who runs it. Commercial platforms charge per host, per data ingested or per user, so the cost grows with the infrastructure. The open stack has no licence fee, but it does have storage and maintenance. In both cases, the most underestimated cost is the time of the people who instrument and maintain the system.
- If we already have Datadog or Dynatrace, do we need anything else?
The licence covers collection and visualisation, not the part that decides the outcome. Someone still has to instrument your own code, choose which metrics reflect the user experience, define SLOs and debug traces when something fails.
- What is OpenTelemetry?
OpenTelemetry is the Cloud Native Computing Foundation's open standard for instrumenting applications and emitting metrics, logs and traces in a common format. Its advantage is portability: you instrument once and can send the data to Prometheus, Grafana, Datadog, Dynatrace or another compatible destination without instrumenting the application again.
- What skills do you need to run observability?
You do not need a role with that name, but the skill: instrumentation with OpenTelemetry, metric and SLO design, and reading distributed traces. It usually sits in DevOps, SRE, platform or senior backend roles. According to Shakers' market analysis, of 2,275 UK job adverts that mention these tools, only 28 have the word observability in the job title.
- How does observability help reduce MTTR?
MTTR is the mean time it takes to resolve an incident. Observability mainly shortens the diagnosis stage: with correlated signals, the team moves from the alert to the cause without reproducing the failure.
Observability does not come in a box. It is built with well-chosen signals, with a standard such as OpenTelemetry that keeps you from being locked into one vendor and, above all, with people who can read what the system is telling them. Have the licence but nobody to instrument the code or define the SLOs? That is the gap.
Shakers is a platform of certified tech talent with proven technology and AI skills: IT contractors who collaborate with your team while observability is designed and instrumented. You can find Site Reliability Engineers, Platform Engineers and DevOps Engineers who collaborate with Shakers.